
What Is an Infographic? Types, Examples and How to Make One
An infographic is a chart, diagram or picture, or a set of them, that presents information so it can be understood at a glance. Four major dictionaries agree on the core idea: information made visual so it is easy to take in.
The four definitions sit side by side in the first table; after that come the word’s origin, common formats, sizes for each social network, accessibility rules and a six-step way to make one. For where visual posts fit in a whole plan, see our social media marketing playbook for small businesses.
Table of Contents
- What is an infographic?
- Where the word “infographic” comes from
- Infographic vs chart: what’s the difference?
- Common types of infographics
- Infographic sizes for social media
- How to make infographics accessible
- How to make an infographic in 6 steps
- Infographic FAQ
What is an infographic?
Merriam-Webster, Cambridge, Oxford and Collins all define an infographic by its job: presenting information in a visual form that is easy to understand. They differ on the detail, as the table shows.
| Dictionary | Definition | Source |
|---|---|---|
| Merriam-Webster | A chart, diagram or illustration (as in a book or magazine or on a website) that uses graphic elements to present information in a visually striking way | Checked against Merriam-Webster: infographic |
| Cambridge Advanced Learner’s | A picture or diagram, or a group of pictures or diagrams, showing or explaining information | Checked against Cambridge Advanced Learner's Dictionary: infographic |
| Oxford Advanced Learner’s | Information or data shown in a chart, diagram, etc. so that it is easy to understand | Checked against Oxford Advanced Learner's Dictionary: infographic |
| Collins (British English) | A graph, diagram or other visual image designed to present complex information in an easily understandable form | Checked against Collins English Dictionary: infographic |
Read together: Merriam-Webster stresses the visual impact, Cambridge allows a group of images, Oxford puts the data first, and Collins adds “complex”. None ties the word to a template, a length or a tool.
Where the word “infographic” comes from
“Infographic” blends info(rmation) and graphic, and Merriam-Webster dates its first known use in the current sense to 1979. It notes the formation appears earlier in other senses from about 1969, including “Infographics” as the title of the National Microfilm Association’s nineteenth meeting in 1970. Checked against Merriam-Webster: infographic (Word History)
Infographics before the word
The idea is much older than the word. Four landmark works, as the libraries and archives that hold or exhibit them describe them:
| Year | Work | What the source says |
|---|---|---|
| 1786 | William Playfair, The Commercial and Political Atlas | Used line graphs for population, import and export data, and contains what seems to be the very first bar chart Checked against Library of Congress, Inside Adams blog: William Playfair (April 2026) |
| 1858 | Florence Nightingale, report on the health of the British Army | Showed Crimean War mortality in a polar area diagram, now known as the Nightingale Rose Diagram, with twelve sections for the months and three colours for causes of death Checked against Lehigh University Libraries exhibit: Nightingale's Rose Diagram |
| 1869 | Charles-Joseph Minard, Carte figurative of the French army’s losses in Russia, 1812–1813 | A statistical map dated November 1869, held at the École des Ponts Checked against École des Ponts, Héritage: Charles-Joseph Minard à Venise |
| 1920s | Otto Neurath and colleagues, including Marie Neurath, Isotype | A method for presenting statistics through pictures, first known as the Vienna Method Checked against University of Reading Special Collections: Marie Neurath Collection |
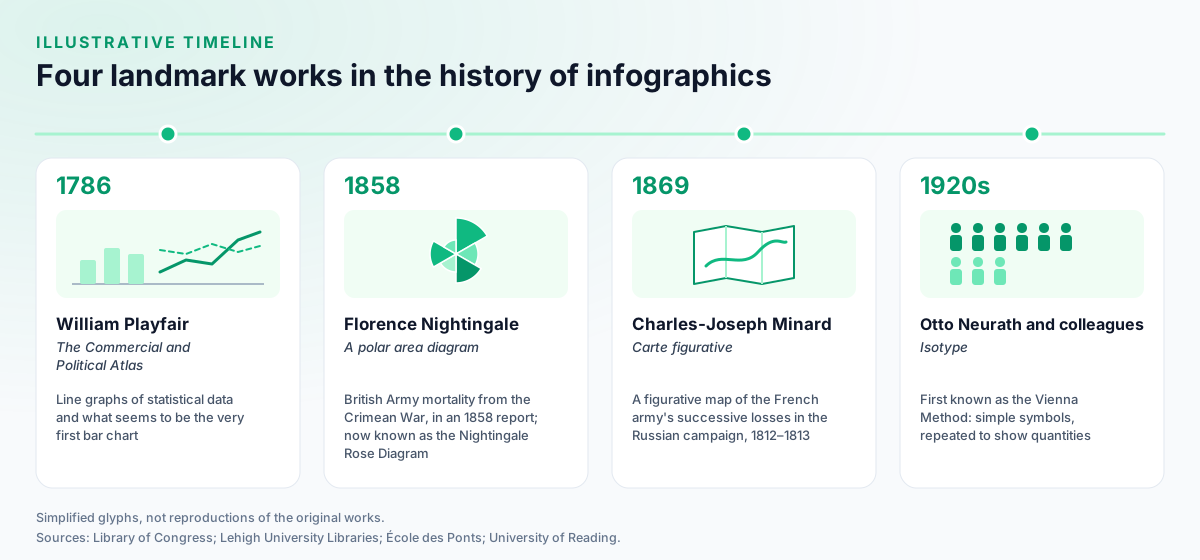
Lehigh University Libraries credits Playfair with the line graph, bar chart, pie chart and circle graph, Checked against Lehigh University Libraries exhibit 'At a Glance: Selected Works in the History of Data Visualization': Playfair's Pie Chart and describes Isotype as showing quantities by giving simple symbols a value and repeating them. Checked against Lehigh University Libraries exhibit: Isotype
Infographic vs chart: what’s the difference?
A chart can be an infographic, but an infographic doesn’t have to be a single chart. Merriam-Webster lists “a chart” first in its definition, so one well-made chart qualifies. Cambridge’s “group of pictures or diagrams” covers the other case: several charts, icons and short labels combined into one graphic that tells a single story.
A practical way to tell them apart: a single chart is the simplest infographic; once a graphic combines several charts, icons and labels to walk the reader through one story, it is usually called an infographic rather than a chart.
Common types of infographics
Most infographics follow one of a handful of layouts, picked by the shape of the information. The dictionaries above don’t list types, so treat these as common formats rather than a fixed taxonomy:
- Statistical: one or more charts around a set of numbers, in the tradition of Playfair’s line and bar charts.
- Timeline: events in date order, such as a product’s history.
- Process: numbered steps or a flow, such as how an order is fulfilled.
- Comparison: two or more options side by side, often as columns.
- List: a short set of tips or facts, each with an icon.
- Map: information placed geographically, as in Minard’s statistical maps.
- Pictogram: repeated symbols standing for quantities, the idea behind Isotype.
Infographic sizes for social media
Design each infographic for the network it will live on: a tall Pin for Pinterest, a portrait image or a carousel for Instagram, and a document or image post for LinkedIn. Pinterest recommends 1000 x 1500 pixels at 2:3 and warns that taller Pins might get cut off in feeds (Pinterest Business Help: Review ad specs). A long infographic fits Instagram better as a carousel of up to 20 slides in the Instagram app (Instagram Help: Share a post with multiple photos or videos), and LinkedIn accepts document posts of up to 100 MB.
| Placement | Upload size (px) | Aspect ratio | Max file size | Max items | Source |
|---|---|---|---|---|---|
| Pinterest · Standard image Pin | 1000 x 1500 Ad spec: Pinterest Business Help: ad specs | 2:3 | 20 MB Web. In the app: 32 MB (ads specs page). | Not recorded | Pinterest Business Help: Review ad specs |
| Instagram · Feed photo post | 1080 x 1350 4:5 → 1080 x 1350 · 1:1 → 1080 x 1080 · 3:4 → 1080 x 1440 · 1.91:1 → 1080 x 566 | 4:5, 1:1, 3:4, 1.91:1 In the app: between 1.91:1 and 3:4 (1080 wide, 566 to 1440 tall). Via the publishing API: 4:5 to 1.91:1. | 8 MB Publishing API limit (JPEG). The app publishes no file-size cap. | Not recorded | Instagram Help: Image resolution of photos you share on Instagram |
| Instagram · Carousel post | 1080 x 1350 | 4:5, 1:1, 3:4, 1.91:1 | Not recorded | 20 | Instagram Help: Share a post with multiple photos or videos |
| LinkedIn · Feed image post | 1080 x 1350 4:5 → 1080 x 1350 · 1:1 → 1080 x 1080 · 3:1 → 1080 x 360 · Min 552 x 276 | 4:5, 1:1, 1.91:1, 3:1 From 3:1 to 4:5 (width:height); wider images are centred and cropped to the max ratio. | 5 MB | 20 | LinkedIn Help: Share photos on LinkedIn |
| LinkedIn · Document (PDF/PPT/DOC) post | Not recorded | Not recorded | 100 MB | Not recorded | LinkedIn Help: Media file types supported on LinkedIn |
| X (Twitter) · In-post image | Not recorded | 16:9, 1:1 Widely reported | 5 MB Photos. Animated GIFs: 5 MB on mobile, 15 MB on web. | 4 | X Help: How to post pictures or GIFs |
| TikTok · Photo post (carousel) | Not recorded | 9:16 Widely reported | 20 MB Per image, Content Posting API. | 35 | TikTok Content Posting API: photo post reference |
| Threads · Carousel post | Not recorded | Not recorded | Not recorded | 20 | Threads API: overview |
Widely reported: the platform does not publish it.
X publishes file limits and allows up to 4 photos per post, but no pixel size for in-post images, so keep text large enough to read on a phone. To cut one wide graphic into slides, use the Instagram carousel splitter. For every other placement, see social media image sizes, Instagram post sizes and how to post on Pinterest.
How to make infographics accessible
Give every infographic a short alt text and a longer description everyone can read, and keep text contrast high. The W3C’s Web Accessibility Initiative says complex images such as charts need a long description of scales, values, relationships and trends in addition to a short alt text, made available to everyone, for example in the main content. Checked against W3C WAI: Images Tutorial — Complex Images
A checklist for each infographic:
- Alt text: one sentence saying what the graphic shows and its main point. Pinterest’s alt text field takes up to 500 characters (Pinterest API v5 OpenAPI description).
- Long description: the key numbers and takeaway in the post text, blog post or caption, so the information doesn’t live only in the image.
- Contrast: WCAG 2.2 asks for at least 4.5:1 for text and images of text, and 3:1 for large text (18 point, or 14 point bold). Checked against W3C: Understanding WCAG 2.2 Success Criterion 1.4.3 Contrast (Minimum) WCAG is a web standard and social networks don’t enforce it, but it is a useful bar for text read on a phone.
- No meaning in colour alone: label lines and segments directly, not only with a colour key.
How to make an infographic in 6 steps
Start from the message, not the template. A layout chosen first tends to bend the information to fit it.
- Write the one message the reader should leave with, in a sentence.
- Gather the numbers with their sources, and put the source on the graphic itself.
- Pick the format from the list above that matches the shape of the information.
- Sketch the order on paper: headline, three to five points, source line. Use your brand’s fonts and colours consistently (see social media branding).
- Build it in a design tool. Canva, for one, has a Free plan available to anyone, with paid Pro and Business plans that can be tried free; Checked against Canva: PricingVendor's own description check the current terms on Canva’s pricing page.
- Export, describe and publish: one size per network, alt text, and the key points repeated in the caption. Then check how it did against the social media KPIs you already track.
A clear, well-sourced infographic is also the kind of resource other sites cite and share, which is how it can turn into earned media.
Infographic FAQ
What is an infographic?
An infographic is a chart, diagram or picture, or a group of them, that presents information so it is quick to understand. Merriam-Webster defines it as a chart, diagram or illustration that uses graphic elements to present information in a visually striking way; Cambridge, Oxford and Collins give similar definitions.
What is the purpose of an infographic?
To make information easy to understand at a glance. Oxford’s learner’s dictionary says the information is shown in a chart or diagram so that it is easy to understand, and Collins says an infographic presents complex information in an easily understandable form.
What is the difference between an infographic and a chart?
A chart can be an infographic: Merriam-Webster lists a chart first in its definition. Infographic is the broader word, and Cambridge notes it can be a group of pictures or diagrams, so one infographic often combines several charts, icons and short text in a single graphic.
How do you make an infographic for free?
Write the one message first, gather numbers with their sources, pick a format such as a timeline, process or comparison, sketch the layout, then build it in a design tool with a free plan, such as Canva Free, and export it at each network’s size. Add alt text and repeat the key information in the post text.
Where does the word ‘infographic’ come from?
It blends information and graphic. Merriam-Webster dates the first known use in the current sense to 1979 and notes earlier uses in other senses from about 1969, including “Infographics” as the title of the National Microfilm Association’s nineteenth meeting in 1970.